Multiple Choice
Figure 10-9 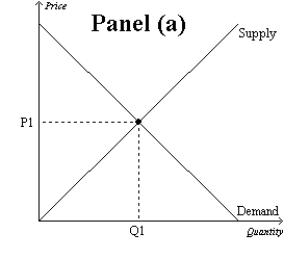
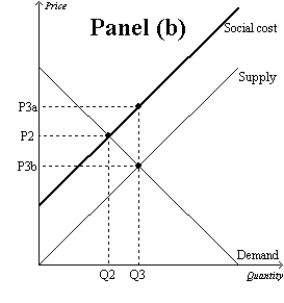
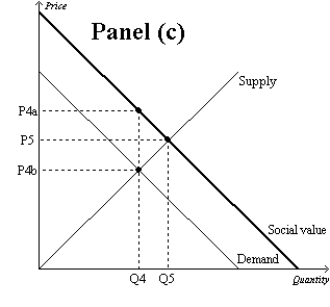
-Refer to Figure 10-9. Which graph represents a market with a negative externality?
A) Panel (a)
B) Panel (b)
C) Panel (c)
D) Both (b) and (c) are correct.
Correct Answer:
Verified
Related Questions
Q162: Table 10-3 Q374: Industrial policy aims to Q375: Patents do not Q376: In the case of a technology spillover, Q377: One drawback to industrial policy is that Q378: Figure 10-9 Q380: A patent is used to
A)reduce pollution by requiring
A)provide firms an incentive to
A)technology![]()
A)disseminate information.
B)offset the

