Figure 10-9 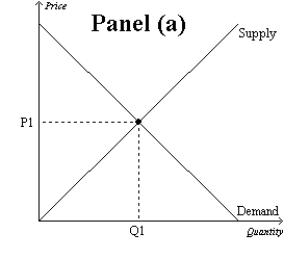
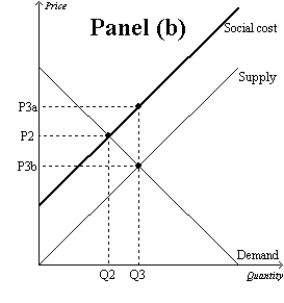
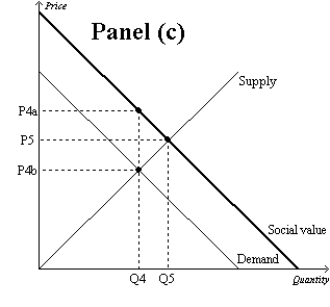
-Refer to Figure 10-9. Which graph represents a market with no externality?
A) Panel (a)
B) Panel (b)
C) Panel (c)
D) None of the above is correct.
Correct Answer:
Verified
Q141: Suppose that cookie producers create a positive
Q158: If the production of computer chips yields
Q360: Which of the following is an example
Q361: If the government wanted to ensure that
Q362: Which of the following is the most
Q363: Which of the following is NOT a
Q366: Technology spillover occurs when
A)a firm passes the
Q367: When technology spillover occurs,
A)it is the government's
Q368: Figure 10-9 Q369: When an industry is characterized by technology![]()
Unlock this Answer For Free Now!
View this answer and more for free by performing one of the following actions

Scan the QR code to install the App and get 2 free unlocks

Unlock quizzes for free by uploading documents