Figure 21-23 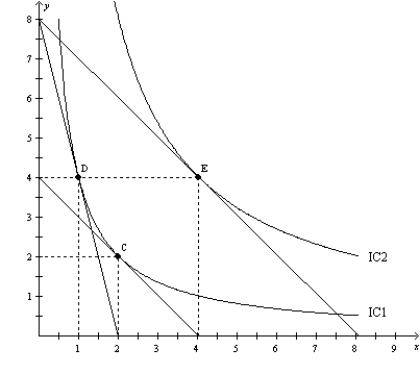
-Refer to Figure 21-23. When the price of X is $80, the price of Y is $20, and the consumer's income is $160, the consumer's optimal choice is D. Then the price of X decreases to $20. The demand curve can be illustrated as the movement from
A) D to E.
B) D to C.
C) C to E.
D) E to D.
Correct Answer:
Verified
Q200: A consumer consumes two normal goods, popcorn
Q252: Dave consumes two normal goods, X and
Q253: A consumer consumes two normal goods, sandwiches
Q254: Consumer theory provides the foundation for understanding
Q255: Pepsi and pizza are normal goods. When
Q258: You can think of an indifference curve
Q259: Pepsi and pizza are normal goods. When
Q260: The income effect of a price change
Q261: Figure 21-25 The figure pertains to a
Q262: Assume that goods X and Y are
Unlock this Answer For Free Now!
View this answer and more for free by performing one of the following actions

Scan the QR code to install the App and get 2 free unlocks

Unlock quizzes for free by uploading documents