Multiple Choice
Table 5-7
The following table shows a portion of the demand schedule for a particular good at various levels of income. 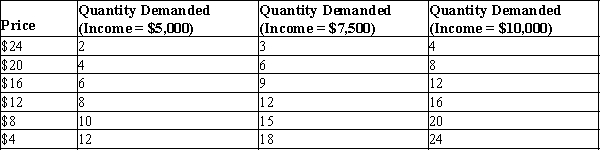
-Refer to Table 5-7. Using the midpoint method, when income equals $7,500, what is the price elasticity of demand between $16 and $20?
A) 0.56
B) 0.75
C) 1.33
D) 1.80
Correct Answer:
Verified
Related Questions

