In order to attribute changes in nest activity to the active influence of the queen, 9 nests were randomly selected for experimental treatment. The normal activity of the nests were measured, and treatments were administered as described below: 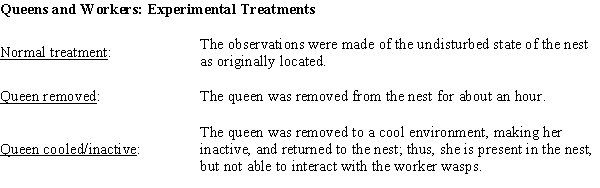 The data for the control treatment and each of the experimental treatments is given in the table below. The Activity Levels are the average proportion of active nest time for workers who were present in the normal and two experimental treatment periods. For example, 0.50 would mean for that nest the average amount of time the workers were actively working was 0.50 of the available time during that treatment. (The colony numbers are for identification in the table only.)
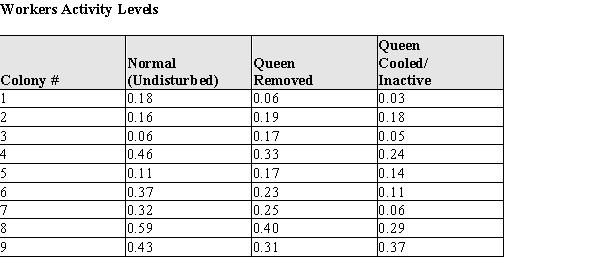
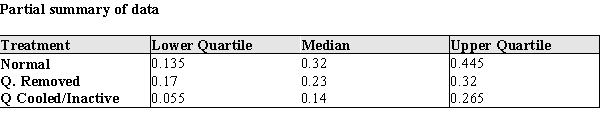
(a) Construct comparative box plots of the active nest times for (a) normal, (b) Queen removed, and (c) Queen Cooled/Inactive. (Note: since the data are proportions, there are no actual units for the data.)
(b) Two current theories about the queen's interaction with workers are that (A) the queen increases worker activity by her mere presence, or (B) she increases worker activity by interacting with worker bees. Based on your plot in part (a), which theory--if either--is supported by the data? Justify your conclusion with an appropriate statistical argument.
(c) What are the mean and standard deviation of the proportion of worker activity for undisturbed wasp nests.  = s =
= s =
(d) One of the nests (Colony #4) has a proportion of worker activity of 0.46. How many standard deviations above/below the mean is the worker activity level in this nest?
(e) The biologists would like to provide some explanatory information for other scientists who would be using their new scale. They would like to state something like the following:
I. "Approximately _____ % of the undisturbed activity levels will be between −2σ and 2σ." OR
II. "At least _____ % of the undisturbed activity levels will be between −2σ and 2σ."
Based on your work so far, would you recommend using the Empirical Rule or Chebyshev's Rule to establish this percentage? Explain your reasoning in a few sentences.
(f) Using your recommended procedure from part (e) what percentage should be used to fill in the blank in the appropriate statement?
Correct Answer:
Verified
View Answer
Unlock this answer now
Get Access to more Verified Answers free of charge
Q6: The % by weight of the element
Q7: One disadvantage of using the mean as
Q8: When the histogram of a data set
Q9: The variance is the positive square root
Q10: The interquartile range is resistant to the
Q12: If there are no outliers, a skeletal
Q13: The % by weight of the element
Q14: Astronomers are interested in the recessional velocity
Q15: For data that is skewed to the
Q16: By definition, an outlier is "extreme" if
Unlock this Answer For Free Now!
View this answer and more for free by performing one of the following actions

Scan the QR code to install the App and get 2 free unlocks

Unlock quizzes for free by uploading documents