The graph below shows position as a function of time for a swimmer competing in a 100-m race swimming twice the length of a 50.0 m pool) . Which of the following statements regarding the motion is incorrect? 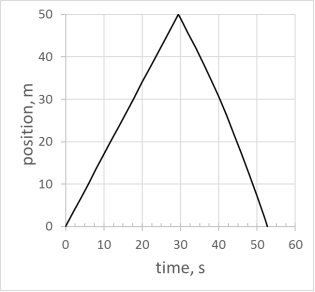
A) The average speed of the swimmer is 1.90 m/s.
B) The average velocity of the swimmer is 1.90 m/s,
C) The average velocity of the swimmer is 0.0 m/s
D) When swimming the second part of the 100-m race, the swimmer is moving with negative velocity.
E) Swimmer's average acceleration during the second part of the 100-m race is negative.
Correct Answer:
Verified
Q56: A projectile is fired vertically upward with
Q62: A particle initially at rest undergoes rectilinear
Q65: A hammer and feather are dropped from
Q67: Two baseballs are thrown vertically up from
Q72: A baseball is thrown vertically up to
Q74: A ball is dropped from the top
Q75: An object is thrown upward with a
Q78: A ball is thrown upward from an
Q79: A distracted driver going along a parkway
Q83: A sandbag is released from a rising
Unlock this Answer For Free Now!
View this answer and more for free by performing one of the following actions

Scan the QR code to install the App and get 2 free unlocks

Unlock quizzes for free by uploading documents