The curve shows the position of an object with time. The object moves with a constant speed, v. 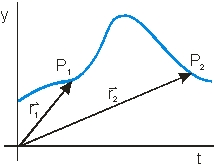 Which of the vector diagrams below best represent the change in velocity vector from P1 to P2?
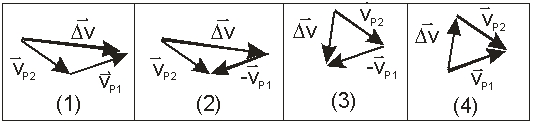
A) 1)
B) 2)
C) 3)
D) 4)
E) None of these is correct.
Correct Answer:
Verified
Q4: A car is traveling south at 30
Q21: A car is at position (x1,y1)= (4
Q25: A particle initially moving at 4.0 m/s
Q36: A car is at position (x1,y1)= (4
Q41: The position vector of an object is
Q43: The position vector of an object is
Q44: The position vector of an object is
Q45: The magnitude of the displacement of a
Q48: The position vector of an object is
Q50: The distance traveled by a particle is
Unlock this Answer For Free Now!
View this answer and more for free by performing one of the following actions

Scan the QR code to install the App and get 2 free unlocks

Unlock quizzes for free by uploading documents