Data extracted from the accounting information system of Turner Corporation produced the following graph. The equation of the dashed line is y = $25x; the equation of the solid line is y = $200 + $5x. 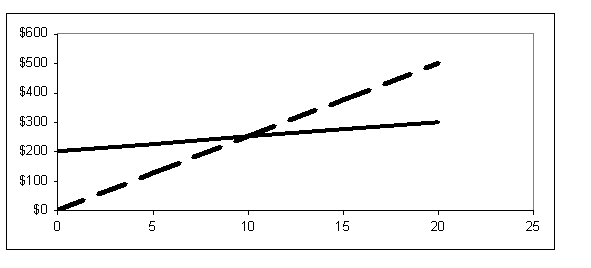 Which of the following terms best describes the graph?
A) Learning curve graph
B) Operating leverage graph
C) Margin of safety graph
D) Cost-volume-profit graph
Correct Answer:
Verified
Q63: Data extracted from the accounting information system
Q64: Data extracted from the accounting information system
Q65: Chisholm Co. has a contribution margin ratio
Q66: Ruben, Inc. is a management consulting firm
Q67: Data extracted from the accounting information system
Q69: When sales are $1,000, the contribution margin
Q70: The Laser Co. produces a single
Q71: (B002) Data extracted from the accounting information
Q72: If the total contribution margin decreases and
Q73: Data extracted from the accounting information system
Unlock this Answer For Free Now!
View this answer and more for free by performing one of the following actions

Scan the QR code to install the App and get 2 free unlocks

Unlock quizzes for free by uploading documents