The figure given below depicts the IS-LM-FE model with floating exchange rates. 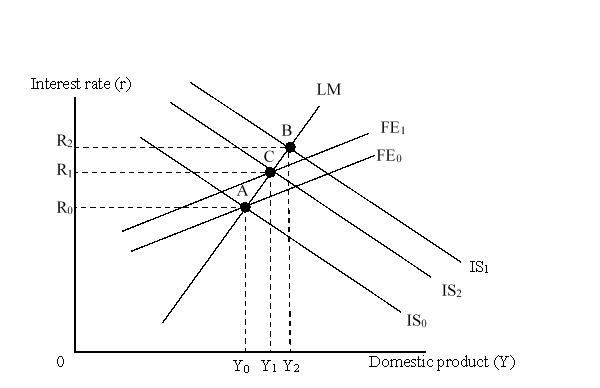 The shift of the FE curve from FE0 to FE1 was caused by:
A) a contractionary monetary policy.
B) official intervention in the foreign exchange market.
C) an improvement in current account position.
D) an appreciation of the country's currency.
Correct Answer:
Verified
Q32: The figure given below depicts the IS-LM-FE
Q33: Which of the following is a possible
Q34: At which of the following did the
Q35: The figure given below depicts the IS-LM-FE
Q36: Under which of the following scenarios is
Q38: Under _ exchange rates, monetary policy is
Q39: Which of the following does NOT occur
Q40: Which of the following are accurate findings
Q41: International macroeconomic policy coordination would give countries
Q42: Which of the following is most likely
Unlock this Answer For Free Now!
View this answer and more for free by performing one of the following actions

Scan the QR code to install the App and get 2 free unlocks

Unlock quizzes for free by uploading documents