The following graph shows the volume of wood produced in a single-species forest.Here  is measured in cubic meters/hectare and t is measured in years.By computing the slopes of the respective tangent lines, estimate the rate at which the wood grown is changing at the beginning of year 10 and at the beginning of year 35.
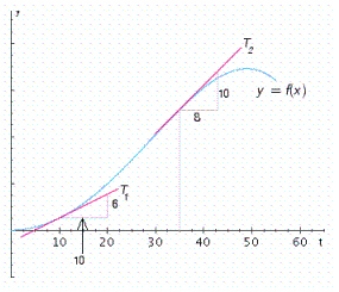
A)  cubic meters/hectare per year in the year 10,


 cubic meters/hectare per year in the year 35
B)  cubic meters/hectare per year in the year 10,


 cubic meters/hectare per year in the year 35
C)  cubic meters/hectare per year in the year 10,


 cubic meters/hectare per year in the year 35
D)  cubic meters/hectare per year in the year 10,


 cubic meters/hectare per year in the year 35
Correct Answer:
Verified
Q12: Under a set of controlled laboratory conditions,
Q13: At a temperature of Q14: Let Q15: Use the four-step process to find the Q15: Use the four-step process to find the Unlock this Answer For Free Now! View this answer and more for free by performing one of the following actions Scan the QR code to install the App and get 2 free unlocks Unlock quizzes for free by uploading documents![]()
![]()

