The figure given below shows short run and long run equilibrium in an aggregate demand-aggregate supply model.The economy shown in this figure is: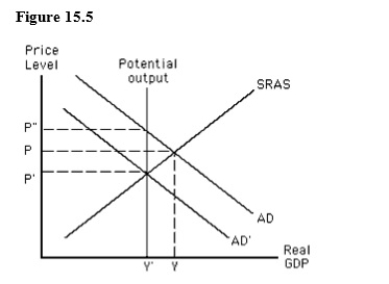
A) in a long-run equilibrium at the price level P and income level Y.
B) in a short-run equilibrium at the price level P and income level Y.
C) experiencing a contractionary gap at price level P and income level Y.
D) experiencing an expansionary gap at price level P" and income level Y'.
E) in a short-run equilibrium at the price level P' and income level Y.
Correct Answer:
Verified
Q92: For a given increase in aggregate demand,the
Q93: The figure given below shows the aggregate
Q94: Over the past 40 years,the most frequent
Q95: Which of the following changes is observed
Q96: Which of the following identities describe the
Q98: If the money supply in an economy
Q99: The figure given below shows the aggregate
Q100: The Fed uses the federal funds rate
Q101: The quantity theory of money states that
Q102: In an economy in which velocity of
Unlock this Answer For Free Now!
View this answer and more for free by performing one of the following actions

Scan the QR code to install the App and get 2 free unlocks

Unlock quizzes for free by uploading documents