The following image shows the aggregate demand and aggregate supply curves of an economy.In the graph below,the rise in the price levels from P1 to P2 is a result of: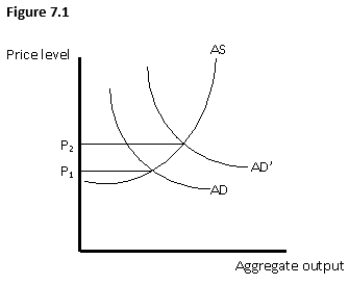
A) cost-pull inflation.
B) cost-push inflation.
C) demand-push inflation.
D) demand-pull inflation.
E) induced inflation.
Correct Answer:
Verified
Q59: Recently,banking has become easier with automated teller
Q60: The official unemployment rate disguises the extent
Q61: One of the most widely reported measures
Q62: The official unemployment rate would be higher
Q63: If the CPI in the United States
Q65: Which of the following decades was characterized
Q66: Inflation is:
A)a reduction in everyone's standard of
Q67: Which of the following is true about
Q68: If the aggregate demand curve shifts rightward,then
Q69: The inflation experienced in the United States
Unlock this Answer For Free Now!
View this answer and more for free by performing one of the following actions

Scan the QR code to install the App and get 2 free unlocks

Unlock quizzes for free by uploading documents