What can be concluded from the chart below which shows inflation versus unemployment rates from 1948 to 2015) ? 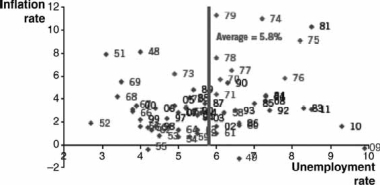
A) In the long run, the Phillips Curve is a robust model.
B) In the short run, unemployment is correlated with inflation.
C) In the long run, unemployment is correlated with inflation.
D) In the short run, unemployment is not always correlated with inflation.
E) In the long run, unemployment is not always correlated with inflation.
Correct Answer:
Verified
Q103: Rational expectations theory sees errors in predicting
Q109: How did adaptive expectations theory revolutionize the
Q110: The first press conference held by a
Q121: One explanation for the length of the
Q122: Who benefits most from inflation?
A) those not
Q129: During a contraction of the money supply,which
Q133: Consider this excerpt from the textbook: "In
Q139: What happens if aggregate demand increases simultaneously
Q140: British economist A. W. Phillips's work on
Q144: Because you are an economics student,your parents
Unlock this Answer For Free Now!
View this answer and more for free by performing one of the following actions

Scan the QR code to install the App and get 2 free unlocks

Unlock quizzes for free by uploading documents