The standard deviation of the data displayed in this dotplot is closest to… 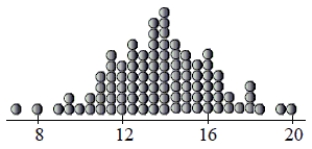
A) 4
B) 2
C) 0.5
D) 1
E) 3.5
Correct Answer:
Verified
Q1: The United States Census collects data on
Q2: Which of the following variables would most
Q3: Which of these variables is most likely
Q4: The distribution below is the number of
Q5: We collect these data from 50 male
Q7: The average scores for Wisconsin schools on
Q8: To see if your school's ACT scores
Q9: The SPCA collects the following data about
Q10: Which type of plot would be least
Q11: Suppose that a Normal model described student
Unlock this Answer For Free Now!
View this answer and more for free by performing one of the following actions

Scan the QR code to install the App and get 2 free unlocks

Unlock quizzes for free by uploading documents