Suppose that the following table shows the average hourly earnings for full-time production workers in various industries for selected years. The linear regression equation for hourly earnings as a function of time is given by  (where x is the number of years after 1970 and y is the average hourly wage) . What does this model predict for the average hourly earnings in 2024? Round your answer to two decimal places.
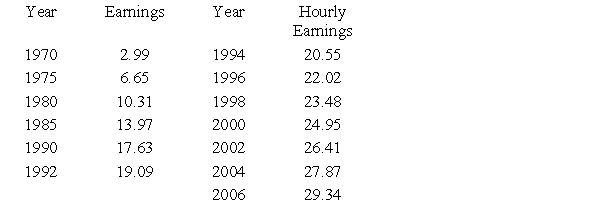
A) $42.51
B) $327.10
C) $43.41
D) $326.20
E) $325.80
Correct Answer:
Verified
Q84: The following table shows the median age
Q85: Test for relative maximum and minimum.
Q86: Test for relative maximum and minimum.
Q87: Test for relative maximum and minimum. �
Q88: Suppose that x units of one input
Q90: Test for relative maximum and minimum.
Q91: Test for relative maximum and minimum.
Q92: Test for relative maximum and minimum.
Q93: Suppose that a manufacturer produces two brands
Q94: Test ![]()
Unlock this Answer For Free Now!
View this answer and more for free by performing one of the following actions

Scan the QR code to install the App and get 2 free unlocks

Unlock quizzes for free by uploading documents