The following table gives the actual or projected population in millions for a certain city for selected years from 2000 to 2050. Use linear regression to find the linear equation that is the best fit for the data, with x equal to the number of years past 2000. 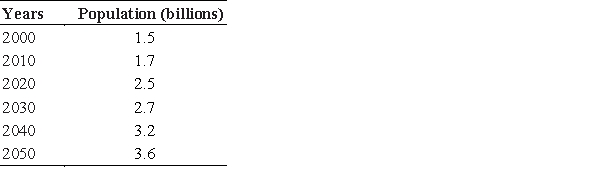
A) 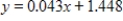
B) 
C) 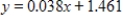
D) 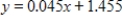
E) 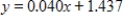
Correct Answer:
Verified
Q94: Test Q95: Find the values for each of the Q96: Find x and y such that Q97: A new food is designed to add Q98: Suppose that the profit from the sale Q100: Find the values for each of the Q101: Suppose that the utility function for two Q102: Suppose that the utility function for two Q103: Find the dimensions (in centimeters) of the Q104: Find x and y such that ![]()
Unlock this Answer For Free Now!
View this answer and more for free by performing one of the following actions

Scan the QR code to install the App and get 2 free unlocks

Unlock quizzes for free by uploading documents