The graphs of a company's total revenue function  and total cost function
  are shown. From the sale of 100 items, 500 items, and 700 items, rank from smallest to largest the amount of profit received.
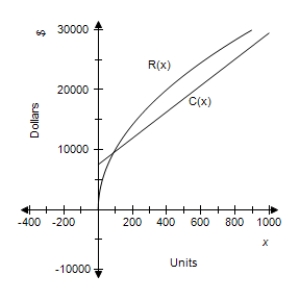
A) 
B) 
C) 
D) 
E) 
Correct Answer:
Verified
Q238: Suppose that the cost function for a
Q239: In this problem, cost, revenue, and profit
Q240: Suppose that the cost function for a
Q241: The graphs of a company's total revenue
Q242: Graph the marginal profit function for the
Q243: The graph of a company's profit function
Q244: The cost per unit of producing a
Q246: Graph the marginal profit function for the
Q247: The graph of a company's profit function
Q248: Graph the marginal profit function for the
Unlock this Answer For Free Now!
View this answer and more for free by performing one of the following actions

Scan the QR code to install the App and get 2 free unlocks

Unlock quizzes for free by uploading documents