The following data represent the daily supply (y in thousands of units) and the unit price (x in dollars) for a product. 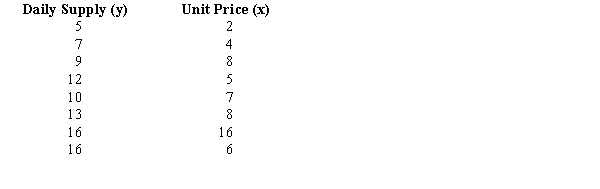
a.Compute and interpret the sample covariance for the above data.
b.Compute the standard deviation for the daily supply.
c.Compute the standard deviation for the unit price.
d.Compute and interpret the sample correlation coefficient.
Correct Answer:
Verified
View Answer
Unlock this answer now
Get Access to more Verified Answers free of charge
Q116: The grade point average of the students
Q137: The ages of a sample of 8
Q139: A local university administers a comprehensive examination
Q140: The growth rate in thepopulation of Atlanta
Q141: The following frequency distribution shows the yearly
Q143: The flashlight batteries produced by one of
Q144: The Michael Painting Company has purchased paint
Q145: The standard deviation of a sample was
Q146: The price of a selected stock over
Q147: The yearly incomes of the top highest
Unlock this Answer For Free Now!
View this answer and more for free by performing one of the following actions

Scan the QR code to install the App and get 2 free unlocks

Unlock quizzes for free by uploading documents