Shown below is a portion of a computer output for a regression analysis relating Y (demand) and X (unit price). 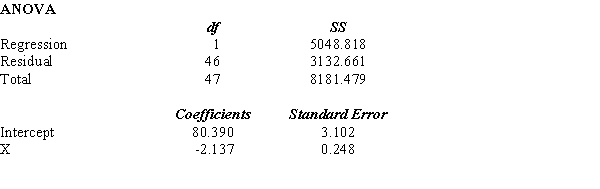
a.Perform a t test and determine whether or not demand and unit price are related. Let = 0.05.
b.Perform an F test and determine whether or not demand and unit price are related. Let = 0.05.
c.Compute the coefficient of determination and fully interpret its meaning. Be very specific.
d.Compute the coefficient of correlation and explain the relationship between demand and unit price.
Correct Answer:
Verified
View Answer
Unlock this answer now
Get Access to more Verified Answers free of charge
Q132: Shown below is a portion of
Q133: The owner of a bakery wants to
Q134: Given below are seven observations collected
Q135: Jason believes that the sales of coffee
Q136: Below you are given information on
Q138: Part of an Excel output relating X
Q139: Below you are given a partial
Q140: Below you are given a partial
Q141: A regression and correlation analysis resulted
Q142: The following sample data contains the number
Unlock this Answer For Free Now!
View this answer and more for free by performing one of the following actions

Scan the QR code to install the App and get 2 free unlocks

Unlock quizzes for free by uploading documents