Shown below is a portion of a computer output for regression analysis relating Y (dependent variable) and X (independent variable). 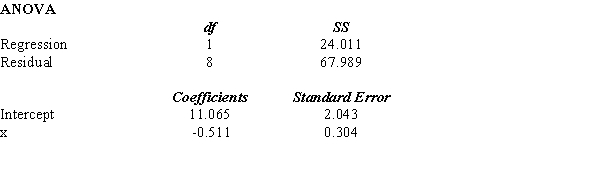
a. What has been the sample size for the above?
b. Perform a t test and determine whether or not X and Y are related. Let = 0.05.
c. Perform an F test and determine whether or not X and Y are related. Let = 0.05.
d. Compute the coefficient of determination.
e. Interpret the meaning of the value of the coefficient of determination that you found in d. Be very specific.
Correct Answer:
Verified
View Answer
Unlock this answer now
Get Access to more Verified Answers free of charge
Q103: The following data represent the number
Q104: Exhibit 14-10
The following information regarding a dependent
Q105: Assume you have noted the following
Q106: Exhibit 14-9
A regression and correlation analysis resulted
Q109: The following data represent the number
Q110: Exhibit 14-10
The following information regarding a dependent
Q110: Exhibit 14-10
The following information regarding a dependent
Q111: Exhibit 14-10
The following information regarding a dependent
Q112: Exhibit 14-8
The following information regarding a dependent
Q113: Part of an Excel output relating X
Unlock this Answer For Free Now!
View this answer and more for free by performing one of the following actions

Scan the QR code to install the App and get 2 free unlocks

Unlock quizzes for free by uploading documents