TABLE 2-16
The figure below is the percentage polygon for the amount of calories for a sample of 36 pizzas products where the upper limits of the intervals are: 310, 340, 370, 400 and 430.
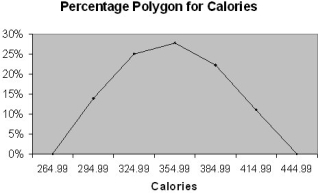
-Referring to Table 2-16, roughly what percentage of pizza products contains between 400 and 430 calories?
A) 89%
B) 100%
C) 0%
D) 11%
Correct Answer:
Verified
Q4: You have collected data on the monthly
Q5: TABLE 2- 5
The following are the
Q6: TABLE 2- 5
The following are the
Q7: TABLE 2- 1
An insurance company evaluates
Q8: TABLE 2-2
At a meeting of information
Q10: TABLE 2- 5
The following are the
Q11: You have collected data on the number
Q12: TABLE 2- 1
An insurance company evaluates
Q13: TABLE 2- 5
The following are the
Q14: MULTIPLE CHOICE. Choose the one alternative
Unlock this Answer For Free Now!
View this answer and more for free by performing one of the following actions

Scan the QR code to install the App and get 2 free unlocks

Unlock quizzes for free by uploading documents