Refer to the following figure:
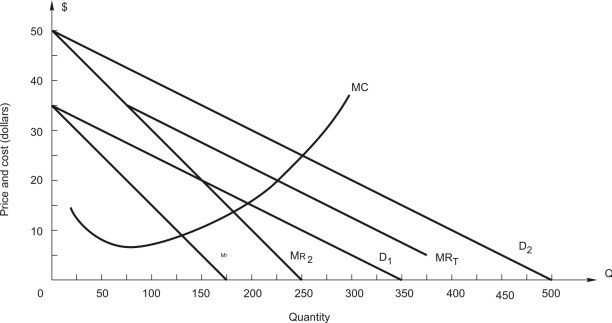
The graph shows the demands and marginal revenue in two markets, 1 and 2, for a price discriminating firm along with total marginal revenue, MRT, and marginal cost.
-How should the firm allocate sales between the two markets?
A) 150 in each market
B) 100 in market 1, 175 in 2
C) 150 in market 1, 300 in 2
D) 112.5 in each market
E) 75 in market 1, 150 in 2
Correct Answer:
Verified
Q28: Refer to the following:
A firm sells
Q30: Refer to the following:
Q30: Gus has 20 acres of land in
Q31: Refer to the following:
Q32: Relate to the following:
A firm is
Q34: Refer to the following figure:

Q35: Refer to the following:
A firm sells
Q36: Refer to the following:
A firm sells
Q37: Refer to the following:
A news magazine offers
Q38: Refer to the following figure:
Unlock this Answer For Free Now!
View this answer and more for free by performing one of the following actions

Scan the QR code to install the App and get 2 free unlocks

Unlock quizzes for free by uploading documents