Use the graph to answer the following question.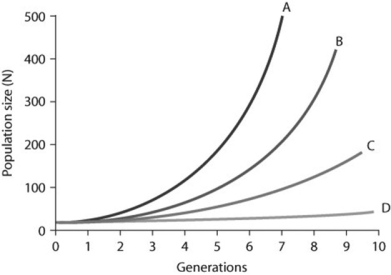
In the figure, curves A-D depict per capita rate increases (r) . Which of the following best explains the difference between the shapes of these curves?
A) The population growth is logistic as generations continue to form.
B) The growth is exponential for curves A and B, but because population growth for C and D is slower, it is considered logistic.
C) Population growth within each curve gets steeper as time passes because growth depends on both per capita rates of increase and current population size.
D) Curve A has the fastest rate of logistic growth.
Correct Answer:
Verified
Q23: In 2008, the population of New Zealand
Q24: Consider two old-growth forests: One is undisturbed
Q25: Which statements about K are correct?
I. K
Q26: Starting from a single individual, what is
Q27: In July 2008, the United States had
Q29: Which of the following causes populations to
Q30: According to the logistic growth equation,
Q31: Use the graph to answer the following
Q32: Use the graph to answer the following
Q33: During exponential growth, a population always _.
A)
Unlock this Answer For Free Now!
View this answer and more for free by performing one of the following actions

Scan the QR code to install the App and get 2 free unlocks

Unlock quizzes for free by uploading documents