The following chart is an example of a 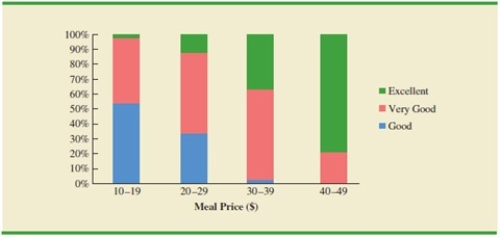
A) Price chart
B) stacked bar chart
C) side by side chart
D) good to excellent chart
Correct Answer:
Verified
Q85: Exhibit 3-1
The following data show the number
Q86: Exhibit 3-1
The following data show the number
Q95: Since the size of the population is
Q96: A bar chart in which each bar
Q98: Exhibit 3-2
A researcher has collected the following
Q101: The following data show the yearly
Q101: Exhibit 3-5
You are given the following frequency
Q102: In 2013, the average age of students
Q104: The ages of a sample of
Q108: Exhibit 3-5
You are given the following frequency
Unlock this Answer For Free Now!
View this answer and more for free by performing one of the following actions

Scan the QR code to install the App and get 2 free unlocks

Unlock quizzes for free by uploading documents