The question refers to the following table, which compares the percent sequence homology of four different parts (two introns and two exons) of a gene that is found in five different eukaryotic species. Each part is numbered to indicate its distance from the promoter (for example, Intron I is the one closest to the promoter) . The data reported for species A were obtained by comparing DNA from one member of species A to another member of species A.
% Sequence Homology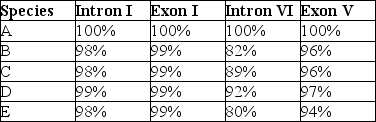
Based on the tabular data, and assuming that time advances vertically, which phylogenetic tree is the most likely depiction of the evolutionary relationships among these five species?
A) 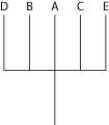
B) 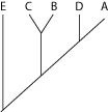
C) 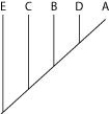
D) 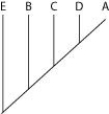
Correct Answer:
Verified
Q20: Q21: Use the following information to answer the Q22: Your professor wants you to construct a Q23: Which of the following statements is accurate Q24: Use the following information to answer the Q26: Use the figure to answer the following Q27: Use the following information to answer the Q28: Use the following information to answer the Q29: Which of the following would be most Q30: Which of the following statements best describes![]()
Unlock this Answer For Free Now!
View this answer and more for free by performing one of the following actions

Scan the QR code to install the App and get 2 free unlocks

Unlock quizzes for free by uploading documents