The graph below shows how yield in two varieties of corn respond to different environmental conditions. 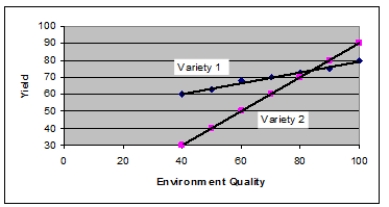 Which of the following statements is TRUE?
A) Under tested conditions, variety 1 has a higher yield than variety 2.
B) Under tested conditions, variety 2 has a higher yield than variety 1.
C) Under tested conditions, variety 2 is more sensitive to environment quality than variety 1.
D) Variety 1 is genetically superior to variety 2.
E) Variety 2 is genetically superior to variety 1.
Correct Answer:
Verified
Q39: Phenotypic variation in a trait is often
Q40: _ is a way to measure the
Q41: Suppose that researchers estimate that broad-sense heritability
Q42: Total phenotypic variance CANNOT be broken down
Q43: Which model BEST explains inheritance of complex
Q45: Knowing the _ of a trait has
Q46: If broad-sense heritability for a trait is
Q47: QTL mapping requires which of the following?
Q48: When _ is high for a particular
Q49: Estimates of heritability made by comparing related
Unlock this Answer For Free Now!
View this answer and more for free by performing one of the following actions

Scan the QR code to install the App and get 2 free unlocks

Unlock quizzes for free by uploading documents