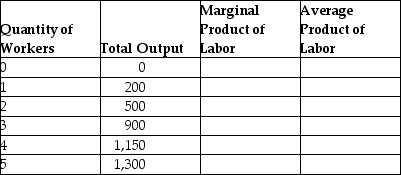
Fill in the missing values in the following table. Draw one graph showing how total output increases with the quantity of workers hired, and another graph showing the marginal product of labor and the average product of labor.
Correct Answer:
Verified
Q141: Average fixed costs of production
A)remain constant.
B)will rise
Q142: If the 15th unit of output has
Q143: Marginal cost is calculated for a particular
Q146: If fixed costs do not change, then
Q148: Which of the following explains why the
Q151: The change in a firm's total cost
Q156: The shape of the average total cost
Q156: Marginal cost is the
A) change in average
Q157: Which of the following statements is false?
A)Marginal
Q159: Damian owns a tattoo parlor and has
Unlock this Answer For Free Now!
View this answer and more for free by performing one of the following actions

Scan the QR code to install the App and get 2 free unlocks

Unlock quizzes for free by uploading documents