Three scatter diagrams are given below.How many of the diagrams present data that can be described by a linear relationship and,therefore,justifiably summarized by the correlation coefficient?
Plot A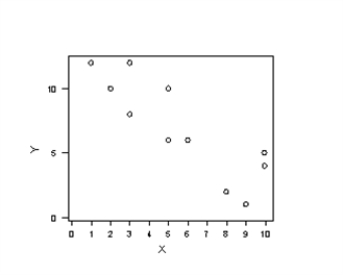
Plot B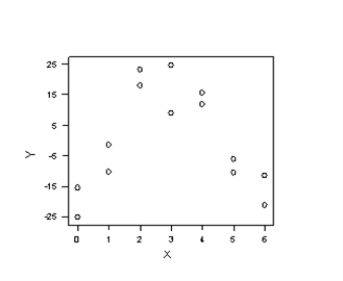
Plot C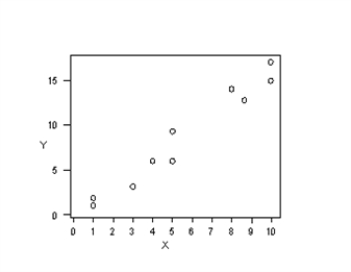
A) Plot A
B) Plot B
C) Plot A and Plot B
D) Plot A and Plot C
Correct Answer:
Verified
Q73: In Excel's Histogram tool,how are bins defined?
Q74: _ is a methodology for drawing conclusions
Q75: One of the most common types of
Q76: The times (in minutes)required by a sample
Q77: Define binomial and Poisson distributions.State their probability
Q79: State the steps involved in a hypothesis
Q80: Suppose that a scatter diagram depicts a
Q81: What are the typical soldering defects in
Q82: What is the team's position on process
Q83: Many new industries-such as bioinformatics,medical imaging,and nanotechnology-are
Unlock this Answer For Free Now!
View this answer and more for free by performing one of the following actions

Scan the QR code to install the App and get 2 free unlocks

Unlock quizzes for free by uploading documents