Use the figure below to answer the following question(s) .
Figure 11-1 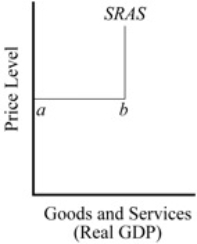
-Refer to Figure 11-1. Consider the short-run aggregate supply curve SRAS. What is the segment between a and b called?
A) the new classical range
B) the Keynesian range
C) the flexible wage and price range
D) the balanced budget range
Correct Answer:
Verified
Q26: Keynesian analysis implies that potential output and
Q38: The consumption function shows the relationship between
A)
Q44: Keynesian analysis suggests that a planned budget
Q63: Long lags make discretionary policy less effective
Q65: Because of automatic stabilizers, government budget deficits
Q66: The main reason that the deficit grows
Q67: Automatic stabilizers will shift the government budget
Q69: In the midst of the Great Depression
Q84: Use the figure below to answer the
Q85: Figure 11-4 ![]()
Unlock this Answer For Free Now!
View this answer and more for free by performing one of the following actions

Scan the QR code to install the App and get 2 free unlocks

Unlock quizzes for free by uploading documents