What does the graph below show? 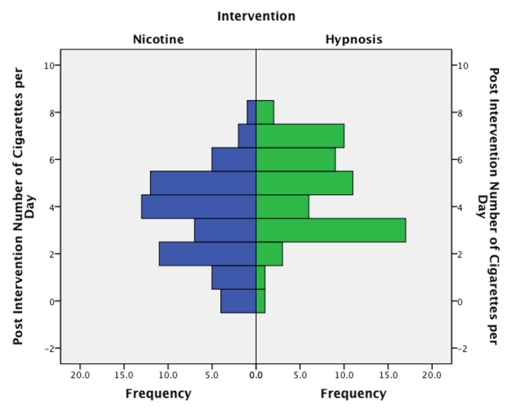
A) Both groups show a positively skewed distribution.
B) Both groups show a negatively skewed distribution.
C) For those who used nicotine patches there is a fairly normal distribution,whereas those who used hypnosis show a slightly negatively skewed distribution.
D) For those who used nicotine patches there is a fairly normal distribution,whereas those who used hypnosis show a positively skewed distribution.
Correct Answer:
Verified
Q3: Imagine we took a group of smokers,
Q11: Looking at the graph below,which intervention was
Q12: Based on the chart,what was the median
Q13: What can we say about the graph
Q14: Looking at the graph below,which intervention was
Q15: A study was done to investigate the
Q17: What is the graph below known as?
Q18: Which of the following statements best describes
Q20: Approximately what is the median success score
Q21: We took a sample of children who
Unlock this Answer For Free Now!
View this answer and more for free by performing one of the following actions

Scan the QR code to install the App and get 2 free unlocks

Unlock quizzes for free by uploading documents