What does the graph below indicate about the normality of our data? 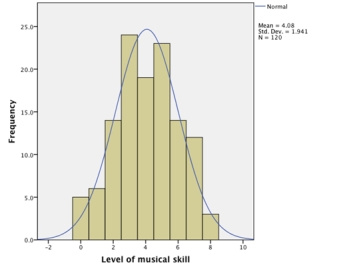
A) The histogram reveals that the data have multivariate normality.
B) We cannot infer anything about the normality of our data from this graph.
C) The histogram reveals that the data are more or less normal.
D) The histogram reveals that the data deviate substantially from normal.
Correct Answer:
Verified
Q1: Which of the following transformations is most
Q2: What does the assumption of independence mean?
A)This
Q3: Which of the following is not an
Q4: Should you use significance tests of skew
Q5: The assumption of homogeneity of variance is
Q10: Imagine you conduct a t-test using IBM
Q11: What does the graph below indicate about
Q15: 15,467 people rated how much they liked
Q17: The test statistics we use to assess
Q19: Which of the following symbols does
Unlock this Answer For Free Now!
View this answer and more for free by performing one of the following actions

Scan the QR code to install the App and get 2 free unlocks

Unlock quizzes for free by uploading documents