Which graph shows data that are more suitable for regression analysis? 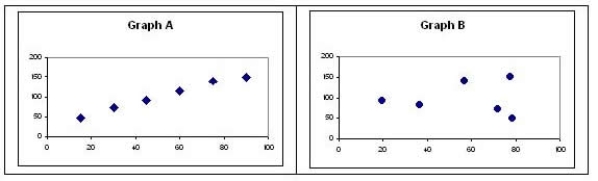
A) Graph A
B) Graph B
C) Neither Graph A nor Graph B
D) Cannot be determined
Correct Answer:
Verified
Q115: Consider the following cost data for
Q116: In a regression equation, fixed costs per
Q117: Which of the following is an alternative
Q118: Simple regression analysis output produces a variety
Q119: Which of the following is not an
Q121: Three different divisions of a university
Q122: A firm has the capacity to produce
Q123: Which of the following are disadvantages of
Q124: A scatter plot is especially useful when
Q125: Three different divisions of a university
Unlock this Answer For Free Now!
View this answer and more for free by performing one of the following actions

Scan the QR code to install the App and get 2 free unlocks

Unlock quizzes for free by uploading documents