Refer to the graph shown. When price increases from $4 to $6, total revenue: 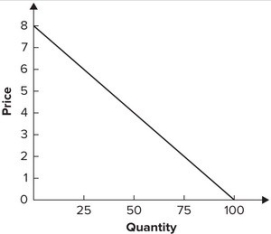
A) increases from $200 to $250.
B) increases from $150 to $200.
C) decreases from $200 to $150.
D) decreases from $250 to $200.
Correct Answer:
Verified
Q121: Cross-price elasticity of demand is defined as
Q123: Income elasticity is defined as the:
A) change
Q124: The Honolulu tourism commission proposed a 6
Q127: It is estimated that a 10 percent
Q127: Refer to the graph shown. Total revenue
Q128: For normal goods, income elasticity is:
A) greater
Q130: Refer to the graph shown. Between points
Q131: Refer to the graph shown. When price
Q134: Refer to the graph shown. Demand is
Q136: An economist estimates that with every 15
Unlock this Answer For Free Now!
View this answer and more for free by performing one of the following actions

Scan the QR code to install the App and get 2 free unlocks

Unlock quizzes for free by uploading documents