Refer to the graph shown. The line segment that represents average variable costs of producing Q* is: 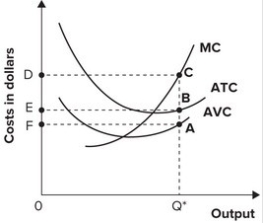
A) AQ*.
B) BQ*.
C) CQ*.
D) AB.
Correct Answer:
Verified
Q126: At very high levels of output, total
Q129: The marginal cost curve:
A) first rises and
Q133: Refer to the following graph. 
Q134: The U shape of the average total
Q134: Refer to the graph shown. Total fixed
Q136: Other things being equal, when average productivity
Q137: Refer to the following graph.
Q142: If marginal cost exceeds average total cost:
A)
Q146: The average variable cost curve is a
Q160: Whenever the marginal cost curve lies below
Unlock this Answer For Free Now!
View this answer and more for free by performing one of the following actions

Scan the QR code to install the App and get 2 free unlocks

Unlock quizzes for free by uploading documents