The following graph shows average fixed costs, average variable costs, average total costs, and marginal costs of production. 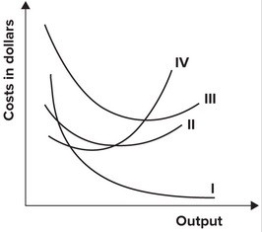 In the graph shown, the marginal cost curve is represented by which curve?
A) I
B) II
C) III
D) IV
Correct Answer:
Verified
Q105: If a firm's average fixed cost is
Q114: When output is 20, fixed costs are
Q121: Refer to the graph shown. This set
Q122: Refer to the following graph. 
Q123: Refer to the graph shown. The line
Q124: Which of the following cost curves is
Q126: The following graph shows average fixed costs,
Q128: Refer to the graph shown. Total cost
Q129: Refer to the graph shown. Total variable
Q131: The typical average variable cost curve:
A) is
Unlock this Answer For Free Now!
View this answer and more for free by performing one of the following actions

Scan the QR code to install the App and get 2 free unlocks

Unlock quizzes for free by uploading documents