Refer to the graph shown. The output range in region a is associated with: 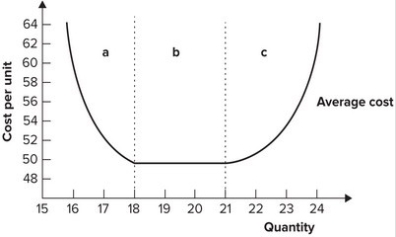
A) increasing marginal productivity.
B) constant returns to scale.
C) economies of scale.
D) diseconomies of scale.
Correct Answer:
Verified
Q41: The level of production that minimizes long-run
Q42: Constant returns to scale means that long-run:
A)
Q43: Generally, as the size of a firm
Q45: Refer to the graph shown. The output
Q46: Which of the following provides the best
Q50: The graph shown exhibits constant returns to
Q52: Refer to the graph shown. The output
Q53: Diseconomies of scale are associated with:
A) an
Q54: The long-run average cost of producing 12
Q60: Diseconomies of scale are associated with:
A) decreasing
Unlock this Answer For Free Now!
View this answer and more for free by performing one of the following actions

Scan the QR code to install the App and get 2 free unlocks

Unlock quizzes for free by uploading documents