Refer to the graph shown. Between points B and D, marginal utility is: 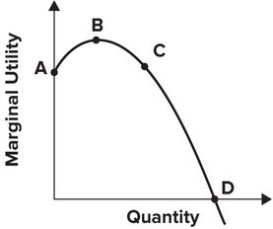
A) increasing, and so total utility is falling.
B) positive, and so total utility is increasing.
C) positive, and so total utility is falling.
D) increasing, and so total utility is at its maximum.
Correct Answer:
Verified
Q24: Jack Sprat could eat no fat, his
Q25: If the total utility curve is a
Q27: If Steve willingly consumes another slice of
Q29: Refer to the following figure. 
Q32: What is the marginal utility of
Q34: Refer to the following graph.
Q34: As long as total utility is increasing,
Q35: Refer to the graph shown. Total utility
Q36: Suppose one Big Mac gives you a
Q37: Refer to the graph shown. Between points
Unlock this Answer For Free Now!
View this answer and more for free by performing one of the following actions

Scan the QR code to install the App and get 2 free unlocks

Unlock quizzes for free by uploading documents