Refer to the following graph. 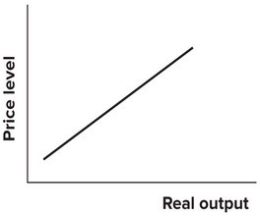 The upward sloping relationship in the diagram represents the:
A) aggregate demand curve.
B) short-run aggregate supply curve.
C) long-run aggregate supply curve.
D) quantity adjustment curve.
Correct Answer:
Verified
Q95: Federal Reserve policy makers argue about whether
Q96: If a fall in the price level
Q97: If productivity increases by 5 percent but
Q98: If the dollar appreciates while foreign income
Q99: In early 2000s, oil prices were rising
Q101: Refer to the graph shown. A movement
Q102: In the long run, the position of
Q103: Refer to the graph shown. A decrease
Q104: Refer to the graph shown. A movement
Q105: Refer to the graph shown. A decrease
Unlock this Answer For Free Now!
View this answer and more for free by performing one of the following actions

Scan the QR code to install the App and get 2 free unlocks

Unlock quizzes for free by uploading documents