Refer to the graph shown. The segment of the demand curve between the initial equilibrium price of $5.00 and the new equilibrium price of $3.00 is: 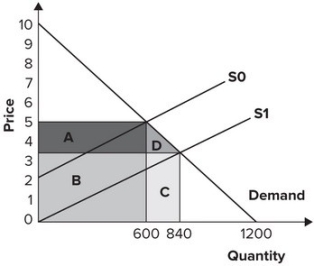
A) elastic.
B) inelastic.
C) perfectly elastic.
D) perfectly inelastic.
Correct Answer:
Verified
Q155: Refer to the graph shown. After an
Q156: Refer to the graph shown. An effective
Q157: Which of the following statements is true?
A)
Q158: The more inelastic demand is, the:
A) more
Q159: Refer to the graph shown. Initially, the
Q161: A general rule of political economy in
Q162: Refer to the graph shown. Which statement
Q163: The problems created by price controls become
Q164: Refer to the graph shown. In the
Q165: Consumers have the greatest incentive to lobby
Unlock this Answer For Free Now!
View this answer and more for free by performing one of the following actions

Scan the QR code to install the App and get 2 free unlocks

Unlock quizzes for free by uploading documents