Refer to the graph shown. An effective price ceiling at $3 causes consumer surplus to: 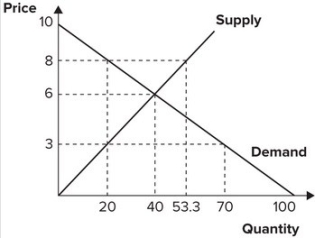
A) increase from 80 to 120.
B) fall from 110 to 80.
C) increase from 120 to 130.
D) fall from 130 to 120.
Correct Answer:
Verified
Q118: Suppose that 75 percent of a cigarette
Q119: An excise tax is imposed on smartphones.
Q120: Refer to the graph shown. If the
Q121: Refer to the graph shown. An effective
Q122: Refer to the graph shown. An effective
Q124: The price of gasoline is generally higher
Q125: Refer to the graph shown. With an
Q126: Refer to the graph shown. With an
Q127: Refer to the following graph. 
Q128: Refer to the graph shown. With an
Unlock this Answer For Free Now!
View this answer and more for free by performing one of the following actions

Scan the QR code to install the App and get 2 free unlocks

Unlock quizzes for free by uploading documents