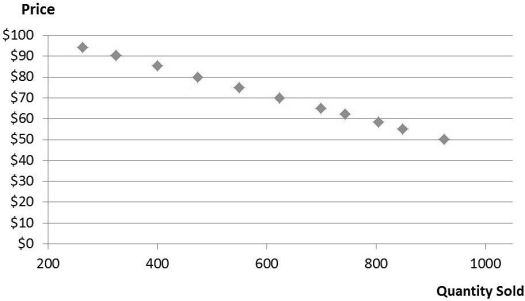
 The scatter diagram above shows the actual data for the price and quantity demanded of a product.
-Refer to the scatter diagram above. The scatter diagram suggests all of the following, except which one?
A) The R2 is likely to be greater when an nonlinear demand curve is estimated compared to a straight- line demand curve.
B) The estimated demand will have a negative slope.
C) A straight- line demand curve is likely to be a better fit to the actual data compared to a nonlinear demand curve.
D) The R2 is likely to be greater when a straight- line demand curve is estimated compared to a nonlinear demand curve.
Correct Answer:
Verified
Q70: If a scatter plot of the data
Q71: Suzie's Bagels is a breakfast deli located
Q72: Using Excel, Best Paints estimates the log-
Unlock this Answer For Free Now!
View this answer and more for free by performing one of the following actions

Scan the QR code to install the App and get 2 free unlocks

Unlock quizzes for free by uploading documents