The diagram below shows the MRP curve for a firm producing high school math textbooks. The factor of production being considered here is hours of labour. 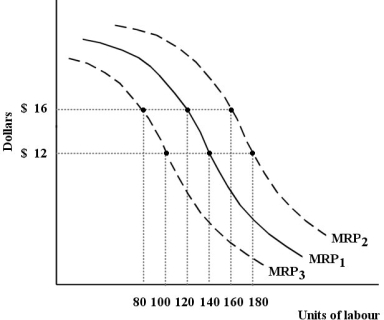 FIGURE 13- 2
-Refer to Figure 13- 2. This firm's MRP curve is the firm's
A) market demand curve for textbooks.
B) total product curve for labour.
C) marginal product of labour curve.
D) derived demand for textbooks.
E) demand curve for labour.
Correct Answer:
Verified
Q21: The demand and supply curves shown below
Q22: Consider labour hired for $18 per hour.
Q23: Consider labour that is hired for $18
Q24: The table below shows the total
Q25: In a perfectly competitive labour market, a
Q27: Non- monetary considerations tend to be most
Q29: Suppose all Canadians earned equal incomes. In
Q30: Which of the following would be least
Q31: The table below shows the total
Q109: John Smith plays baseball for $500 000
Unlock this Answer For Free Now!
View this answer and more for free by performing one of the following actions

Scan the QR code to install the App and get 2 free unlocks

Unlock quizzes for free by uploading documents