The figure below shows the isocost lines and the isoquant map for a firm producing golf tees. 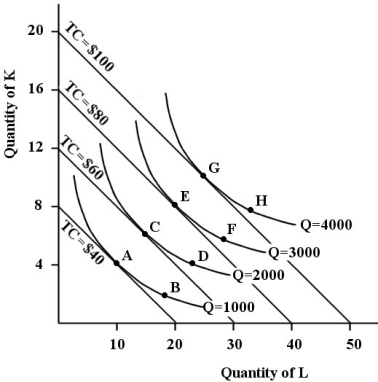 FIGURE 8- 6
-Refer to Figure 8- 6. Suppose this firm is producing 4000 golf tees with 10 units of capital and 25 units of labour. The marginal rate of substitution between capital and labour is
A) 100.
B) 40.
C) 0.025.
D) 0.4.
E) 2.5.
Correct Answer:
Verified
Q97: The figure below shows the isocost lines
Q98: A downward- sloping LRAC curve will shift
Q99: A firm's least- cost position for producing
Q100: Consider a firm that uses only labour
Q101: The fact that isoquants are downward sloping
Q103: The figure below shows the isocost lines
Q104: The following table shows the marginal
Q105: Assume a firm is using 10 units
Q106: The figure below shows the isocost lines
Q119: ![]()
Unlock this Answer For Free Now!
View this answer and more for free by performing one of the following actions

Scan the QR code to install the App and get 2 free unlocks

Unlock quizzes for free by uploading documents