Multiple Choice
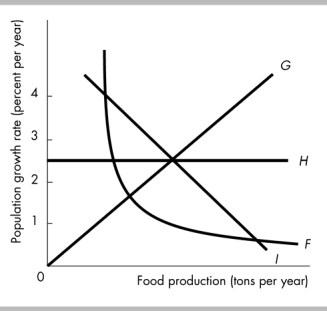
-In the above figure, which curve indicates that the level of food production does not affect the population growth rate?
A) I
B) H
C) F
D) G
Correct Answer:
Verified
Related Questions
Q304: Q309: Q317: Q319: If a curve rises and then falls, Q320: Q322: A diagram shows the quantity of tomatoes Q323: A graph measures y on the vertical Unlock this Answer For Free Now! View this answer and more for free by performing one of the following actions Scan the QR code to install the App and get 2 free unlocks Unlock quizzes for free by uploading documents![]()
![]()
![]()
![]()

