Multiple Choice
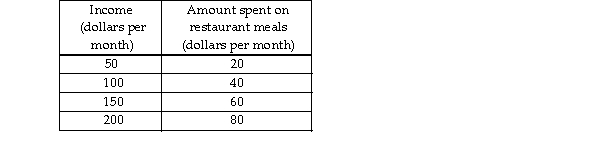
-Using the data in the above table, if income is on the x- axis and the amount spent on restaurant meals is on the y- axis, the graph of the two variables would be
A) horizontal.
B) upward sloping.
C) vertical.
D) downward sloping.
Correct Answer:
Verified
Related Questions

