Multiple Choice
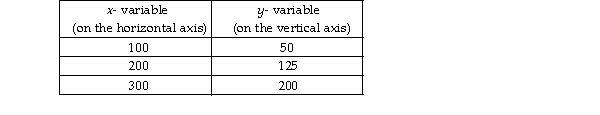
-The above table shows data on two variables. If these data were graphed, the slope of the line would be
A) 1/2.
B) 3/4.
C) 4/3.
D) 2/3.
Correct Answer:
Verified
Related Questions
Q370: Q397: Q531: The change in y = - 20, Q532: The above table gives data on two![]()

