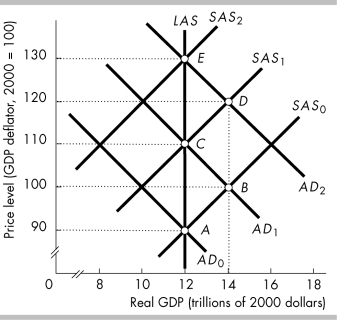
-In the above figure, the movement from point A to B to C to D to E represents
A) demand- pull inflation resulting from persistent increases in the quantity of money.
B) demand- pull inflation resulting solely from wage responses to excess labor demand.
C) cost- push inflation resulting solely from wage responses to excess labor demand.
D) cost- push inflation resulting from persistent increases in the quantity of money.
Correct Answer:
Verified
Q53: To prevent demand- pull inflation
A) real GDP
Q54: As the money wage rate rises,
A) the
Q55: In the above figure, if the economy
Q56: Which monetary policy can be used to
Q57: When the AD and SAS curves intersect
Q59: To stop a demand- pull inflation using
Q60: During a demand- pull inflation, if the
Q61: Cost- push inflation starts with a
A) raising
Q62: Cost- push inflation can be started by
A)
Q63: The initial factors that can create a
Unlock this Answer For Free Now!
View this answer and more for free by performing one of the following actions

Scan the QR code to install the App and get 2 free unlocks

Unlock quizzes for free by uploading documents