The diagram below shows the MRP curve for a firm producing copper plumbing pipe.The factor of production being considered here is hours of labour.
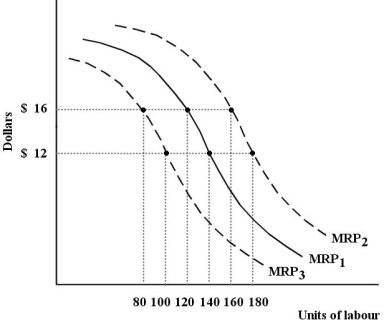 FIGURE 13- 2
-Refer to Figure 13- 2.Suppose this firm has the marginal revenue product curve MRP1.At a wage rate of $12,the profit- maximizing firm will hire units of labour.
A) 180
B) 140
C) 100
D) 120
E) 160
Correct Answer:
Verified
Q11: Consider the following production and cost
Q12: FIGURE 13- 4 The three diagrams below
Q13: Consider the following table for a
Q14: Profit- maximizing firms increase production up to
Q15: Consider the following production and cost
Q17: Which of the following is the best
Q18: The hypothesis of equal net advantage explains
Q20: Suppose that the municipal government of Calgary
Q21: The table below shows the total
Q26: Consider the following table for a firm.The
Unlock this Answer For Free Now!
View this answer and more for free by performing one of the following actions

Scan the QR code to install the App and get 2 free unlocks

Unlock quizzes for free by uploading documents