FIGURE 6- 9 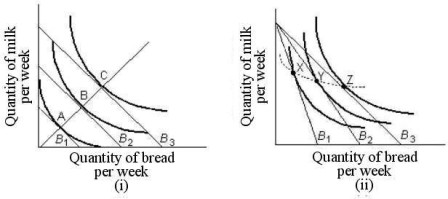
-Refer to Figure 6- 9.In part (i) ,the line joining points A,B,and C is known as ,which shows how .
A) an income- consumption line; consumption changes with changing relative prices and constant income
B) a price- consumption line; consumption changes as relative prices change,with money income constant
C) a price- consumption line; consumption changes as money income and relative prices change
D) an income- consumption line; consumption changes as income changes,with relative prices held constant
E) an indifference map; the value of various combinations of two goods changes
Correct Answer:
Verified
Q62: If consumption of an extra unit of
Q63: The idea that the utility a consumer
Q64: Economists usually assume that consumers
A)are poor judges
Q65: Any consumption point that is on the
Q66: If John consumes only two goods,A and
Q68: Assume the quantity of good X is
Q69: The substitution effect of a price change
Q70: The table below shows the total
Q71: Assume you are consuming two goods,X and
Q72: The demand curve for a good with
Unlock this Answer For Free Now!
View this answer and more for free by performing one of the following actions

Scan the QR code to install the App and get 2 free unlocks

Unlock quizzes for free by uploading documents