This question refers to Table 20.1,which compares the % sequence homology of four different parts (two introns and two exons) of a gene found in five different eukaryotic species.Each part is numbered to indicate its distance from the promoter (for example,intron I is the one closest to the promoter) .The data reported for species A were obtained by comparing DNA from one member of species A to the DNA of another member of species A.
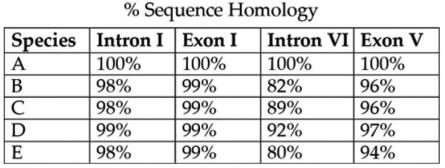 Table 20.1
-Based on the tabular data,and assuming that time advances vertically,which cladogram (a type of phylogenetic tree) is the most likely depiction of the evolutionary relationships among these five species?
A) 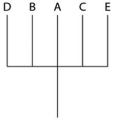
B) 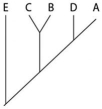
C) 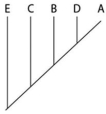
D) 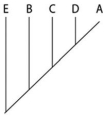
Correct Answer:
Verified
Q28: What kind of evidence has recently made
Q44: A polytomy on a phylogenetic tree represents
A)sister
Q45: Scientists discovered a fossil in China that
Q46: Which kingdom has been replaced with two
Unlock this Answer For Free Now!
View this answer and more for free by performing one of the following actions

Scan the QR code to install the App and get 2 free unlocks

Unlock quizzes for free by uploading documents